
Closed World Security: From Vulnerable Dependencies To Runtime Evidence
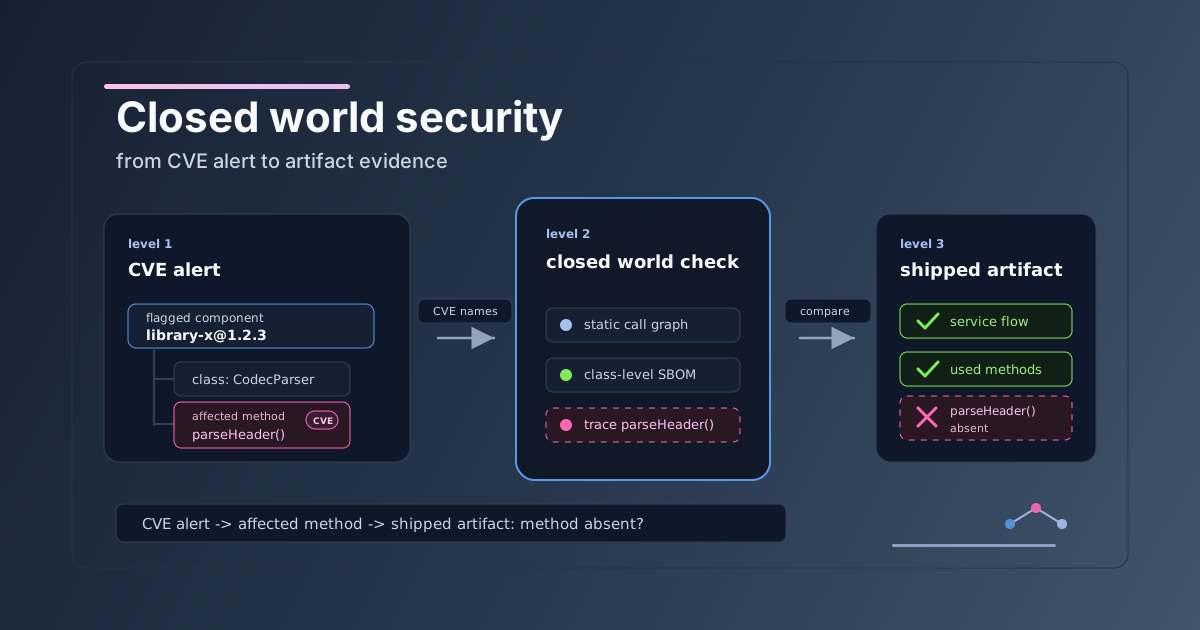
Closed world builds make vulnerability triage concrete: start with a CVE alert, identify the affected code and verify whether that code exists in the shipped artifact.
Dependency scanners do important first-line work. They tell us when a project brings in a component version with a known vulnerability. That is the right first alarm.
It is not the full answer.
A library is often larger than the part an application actually uses. Many libraries contain parsers, protocols, serializers, adapters, old utilities and optional integrations. When a CVE affects one of those paths and the application uses another, the component alert is correct while the runtime risk is different.
The security question is therefore not only whether a dependency is risky. It is also whether the vulnerable code is present, reachable and relevant to the artifact that runs in production.
A CVE Alert Is Evidence
Software Composition Analysis primarily works at the component and version level. Tools such as OWASP Dependency-Check identify project dependencies and check them against known publicly disclosed vulnerabilities.
Conservative alerting is correct at this layer. If a project depends on a vulnerable component version, the scanner reports it. Dependencies change over time. A later feature, configuration change, framework upgrade or integration is enough to make unused code reachable.
The mistake is treating the alert as the whole security story. "This component version has a CVE" is not the same claim as "this application has an executable path to the vulnerable code." Both claims matter. They answer different questions.
The Evidence Ladder
A cleaner way to triage dependency risk is to ask which level of evidence we actually have.
- The dependency is declared in the project.
- The vulnerable component is resolved into the build.
- The vulnerable component is present in the deployed artifact.
- The affected class, method, function or resource is present.
- Application code has a call path to that affected code.
- Attacker-controlled input reaches that call path.
- The exploit preconditions hold in the deployed environment.
These are related claims but they are not interchangeable. A dependency scanner is correct about the first two levels when a vulnerable component version is declared and resolved. A reachability finding establishes a call path without establishing exploitability. When artifact inspection or class-level SBOM metadata shows the affected code is missing, it establishes absence from the shipped artifact without proving that every source dependency is safe.
No single signal carries the whole decision. The goal is to collect specific evidence before deciding how urgent a finding is.
Where Traditional SCA Stops
Traditional SCA gives teams inventory, compliance visibility, early warning and upgrade pressure. It is good at saying, "this project includes a component version associated with known vulnerabilities."
By itself, it does not answer deeper application questions. Is the vulnerable method called? Does a framework discover it? Does deserialization load it? Does runtime configuration activate it? Is the affected class even in the artifact that production runs?
That is not a failure of SCA. It is the boundary of what component and version analysis is designed to prove.
Reachability Is A Different Signal
Reachability-aware tools move the conversation from component presence to code use. They ask whether application code has a path to the vulnerable function, method or code element.
The details vary by tool and ecosystem.
- Snyk marks findings such as
REACHABLE,NO PATH FOUNDandNOT APPLICABLE. Its own documentation is careful about the important caveat: no path found is not proof that no path exists. - Endor Labs, Mend and Veracode expose call paths or traces from application code to vulnerable methods or reachable components where their ecosystem and package-manager support applies.
- Semgrep Supply Chain describes this as codebase-aware reachability. It combines dependency analysis with first-party code analysis so teams prioritize reachable findings.
That is a more specific starting point. A finding with a concrete call path deserves different attention from a component-level alert with no known path from the application.
Still, reachability is not exploitability. Static analysis has to make tradeoffs. Reflection, generated code, dynamic loading, native calls, framework callbacks, broad configuration and incomplete advisory metadata change the answer. In the other direction, a reachable method is not automatically attacker-controllable.
Closed World Design Asks A Different Question
Reachability-aware SCA asks whether application code has a path to vulnerable code.
That question matters after the affected code is present. A closed world build asks the artifact question: did the vulnerable code survive into the deployed artifact?
GraalVM Native Image is the clearest example for JVM applications. It builds under a closed world assumption. The native-image tool performs static analysis to determine which classes, methods and fields are reachable when the application runs. It then compiles the reachable application elements and required resources into a native executable.
This changes the shape of the security question. A dependency available during development or on the build classpath does not prove that an affected method from that dependency exists in the binary that production runs. In that case the team has artifact-level evidence instead of only "we do not think we call it."
Presence in a Native Image executable is already reachability in the builder's static-analysis sense. The Native Image docs define reachable code as classes, methods and fields used by the application and state that only reachable elements are included in the final image. That is a build-time reachability claim, not an exploitability claim.
What The Evidence Looks Like
The evidence is concrete. Native Image produces analysis-level data when requested. Oracle GraalVM Native Image embeds SBOM data in the executable when SBOM support is enabled.
native-image --enable-sbom=embed,class-level,export -jar app.jar app
$JAVA_HOME/bin/native-image-utils extract-sbom --image-path=app | grype

native-image -H:+PrintAnalysisCallTree -H:PrintAnalysisCallTreeType=CSV -jar app.jar app
native-image -H:AbortOnTypeReachable=java.io.File -jar app.jar app
With the class-level option, the SBOM includes modules, classes, constructors, fields and methods that are part of the native executable. The feature is documented for Oracle GraalVM. That matters when an advisory identifies affected classes or methods. A scanner or review script that consumes this metadata checks whether the affected code element exists in the native executable metadata.
Current GraalVM documentation uses $JAVA_HOME/bin/native-image-utils extract-sbom for embedded SBOM extraction. On a GraalVM installation where that binary is absent and $JAVA_HOME/bin/native-image-inspect is present, the extraction command is $JAVA_HOME/bin/native-image-inspect --sbom app | grype. The current docs mark the inspect tool as deprecated and direct users to class-level SBOMs for class, field and method metadata.
There is also a tooling boundary here. Class-level metadata supports this claim only when the advisory names affected classes or methods and the tool reading the SBOM preserves that metadata. The GraalVM docs note that Syft does not preserve the nested class-level metadata when it extracts an SBOM.
The points-to reports answer another question: why is this code reachable? The analysis call tree shows the static view of calls discovered by Native Image. Reachability report options stop the build and dump a trace when a matching type, method or field is reachable. The java.io.File line above is the documented type-reachability example. In a CVE review, replace that pattern with the affected type, method or field named by the advisory.
That gives security review a specific workflow.
- SCA says which dependency version is associated with a CVE.
- The advisory says which class, method, function or resource is affected.
- Class-level artifact metadata says whether the affected code is present in the shipped executable.
- Native Image reachability reports show why a present type, method or field was included.
- Reachability analysis says whether static analysis found a path from application code to affected code.
- Exploitability review says whether that path reaches attacker-controlled input under the CVE preconditions.
Those signals will not always agree. That is exactly why the distinction matters.
Presence Is Not Exploitability
If the affected method is absent from the executable metadata, the strongest claim is simple: the shipped artifact does not contain that affected code. If the affected method is present, the review changes. The question is no longer "did we ship it?" The question becomes "does a production path expose it under the conditions required by the CVE?"
That is where the final evidence lives: which entry point reaches the method, whether attacker-controlled input reaches that entry point and whether the exploit preconditions hold in the deployed configuration.
The VEX labels line up with those distinctions. Absent affected code maps to vulnerable_code_not_present. Present code with evidence that the product does not call or use it maps to vulnerable_code_not_in_execute_path. Present code with evidence that an attacker does not control the required input maps to vulnerable_code_cannot_be_controlled_by_adversary.
VEX Needs Precise Claims
Closed world artifacts also fit naturally with VEX, the Vulnerability Exploitability eXchange format. VEX lets a software producer say whether a product is affected, fixed, under investigation or not affected by a vulnerability.
For not_affected statements, OpenVEX defines machine-readable justifications. These justifications map neatly to the evidence ladder.
component_not_present: the component is not included in the product.vulnerable_code_not_present: the component is included but the vulnerable code is not present.vulnerable_code_not_in_execute_path: the vulnerable code is present but the product does not call or use it.vulnerable_code_cannot_be_controlled_by_adversary: the vulnerable code exists but an attacker cannot control it in the required way.
Those are different statements. A closed world build maps most directly to the first two. Reachability analysis maps to the third. Threat modeling and application context are needed for the fourth.
From Alert Noise To Runtime Evidence
The progression is simple.
- Traditional SCA says: this dependency version is risky.
- Closed world artifact evidence says: this risky code path is absent from the artifact we shipped.
- When the code is present, exploitability evidence says whether production input reaches it under the CVE preconditions.
That progression does not make security automatic. It makes the evidence specific. Specific evidence helps teams spend their time on vulnerabilities with a production path.
Railix is being built in that direction. The goal is to move most application shape out of runtime discovery into a model the build reasons about. Railix plans to support third party steps in the future. Those steps can bring in third party code with vulnerabilities, while artifact evidence tells whether affected code from a CVE is present in the shipped binary. If that code is present, exploitability still needs a closer review of the production path, attacker-controlled input and the CVE preconditions.
Further Reading
- OWASP Dependency-Check on component-level software composition analysis.
- Snyk reachability analysis on reachable, no-path-found and not-applicable vulnerability states.
- Endor Labs call graphs on call paths from application code to vulnerable methods.
- Veracode vulnerable methods on filtering findings where the vulnerable method is in use.
- Mend reachability results on reachable, potentially reachable and unreachable findings.
- Semgrep Supply Chain on codebase-aware reachability analysis.
- GraalVM Native Image basics on static analysis and the closed world assumption.
- GraalVM Native Image SBOM support on class-level metadata and vulnerability scanning.
- GraalVM points-to analysis reports on reachability traces for included code.
- OpenVEX on machine-readable not-affected justifications.