Local Observability For Nano Applications
Developer Console makes event-driven Nano applications easier to inspect by showing events, logs, metrics and runtime configs while the app runs.
Event-driven code is harder to debug than synchronous code. A synchronous call stack gives you an obvious path from caller to callee. In an event-driven runtime, work can move through channels, subscribers, filters, replies and error handlers before the original symptom becomes visible.
That makes local visibility important. A service is running, events are moving and you want to know what actually happened. Did the request arrive? Which event was published? Did a subscriber match it? Did the config change apply? Is the service still alive?
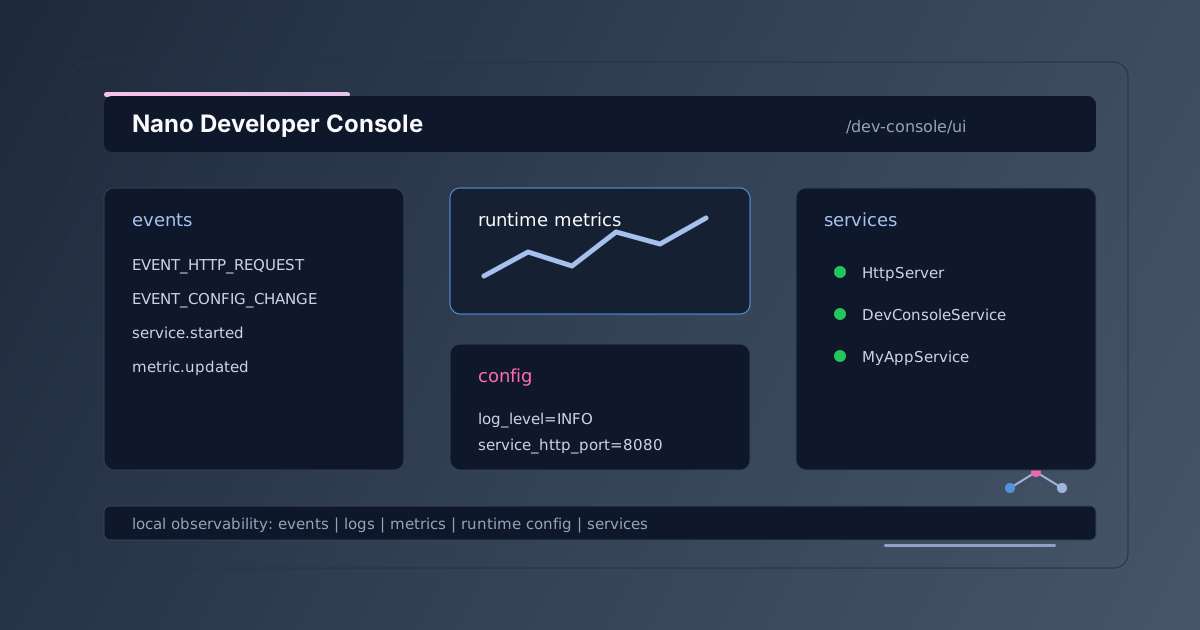
The Nano Developer Console is a Nano service for that debugging surface. It adds a local HTTP UI and JSON endpoints for recent events, logs, system metrics, runtime configuration and service state.
Why Events Need An Inspection Surface
That question matters more in event-driven code because the control flow is no longer sitting in one stack trace. A request may publish an event, another service may react, a third service may emit a reply and an error may be handled on a separate channel. Developer Console gives the running process a local inspection surface, mounted under /dev-console, so those runtime movements are visible while the application is still on the developer machine.
What It Shows
- Live events with pause and export controls.
- Live logs from the running Nano application.
- Runtime metrics such as heap usage, CPU usage, thread counts and events.
- Configuration values that can be changed while the app is running.
- Service start and stop controls when service indexing is configured.
The console is intentionally close to the runtime model. It does not try to hide Nano behind generic dashboards. If your application is built around services and events, the local observability surface should show services and events.
How To Start It
Add DevConsoleService next to the services in your Nano app. By default, the UI is mounted at http://localhost:8080/dev-console/ui.
Nano nano = new Nano(Map.of(
    CONFIG_SERVICE_HTTP_PORT, "8080"
), new DevConsoleService(), new HttpServer(), new MyAppService());
This is the same explicit-service style as the rest of Nano. The console is present because the application starts it. Remove the service and it is omitted from the runtime.
What The Mount Path Means
The console is mounted under /dev-console by default. The UI lives at http://localhost:8080/dev-console/ui. Keeping the console under a distinct path makes it easier to recognize which endpoints belong to application behavior and which endpoints belong to local inspection.
That boundary helps when a service also exposes its own HTTP API. The console should stay visible during development but should not blur into the business API.
The UI Is Only Half The Story
A local observability tool should serve both a person and a script. The Developer Console exposes a UI for inspection and JSON endpoints for runtime data. That helps during manual debugging, smoke tests and automated checks around local development environments.
For example, a developer can query the console endpoints from a script and analyze metrics over a time window. This can also be done retroactively by exporting logs since the service started. A test can poll the JSON endpoint to confirm that a recent event was emitted.
Event Inspection Is The Center
Nano applications are event-oriented, so the first local question is often: what event did the runtime see? The event view helps answer that before you spend time reading logs. If the event is missing, the problem is upstream. If the event exists and no subscriber reacts, the problem is in routing, filtering or service startup. If the subscriber reacts and the response is wrong, the problem is inside the handler.
That order gives local debugging a simple structure. Event first, subscriber second, error third. Good logs are still important; they make root-cause analysis much faster once the event path is clear.
Where It Fits
The console keeps recent observability data in memory. That suits development and test environments where quick inspection matters more than long-term storage. It is designed for the moment when you are building or fixing the service and need to trace a flow.
It is not trying to be a durable telemetry backend. It is closer to an inspection window for the process in front of you: recent events, current config, service state and the logs you need while the behavior is still fresh.
What To Watch
A console can show what the runtime saw but it cannot fix unclear event design. Give events names that describe what happened, keep payload types predictable and avoid hiding important state changes behind generic channels. The clearer the event model is, the better the debugging surface becomes.